As players progress in their tennis careers, arguably the hardest transition they go through is jumping from high level junior tennis to the professional ranks. The world of fancy hotels, top notch facilities, and feeling of proximity to the top of our sport is replaced by the reality of Futures – the minor leagues of professional tennis. You need to climb the rankings ladder again by competing in remote tennis clubs, where time on the practice court often constitutes wishful thinking, and for the first time you’re playing against opponents literally fighting for their livelihood.
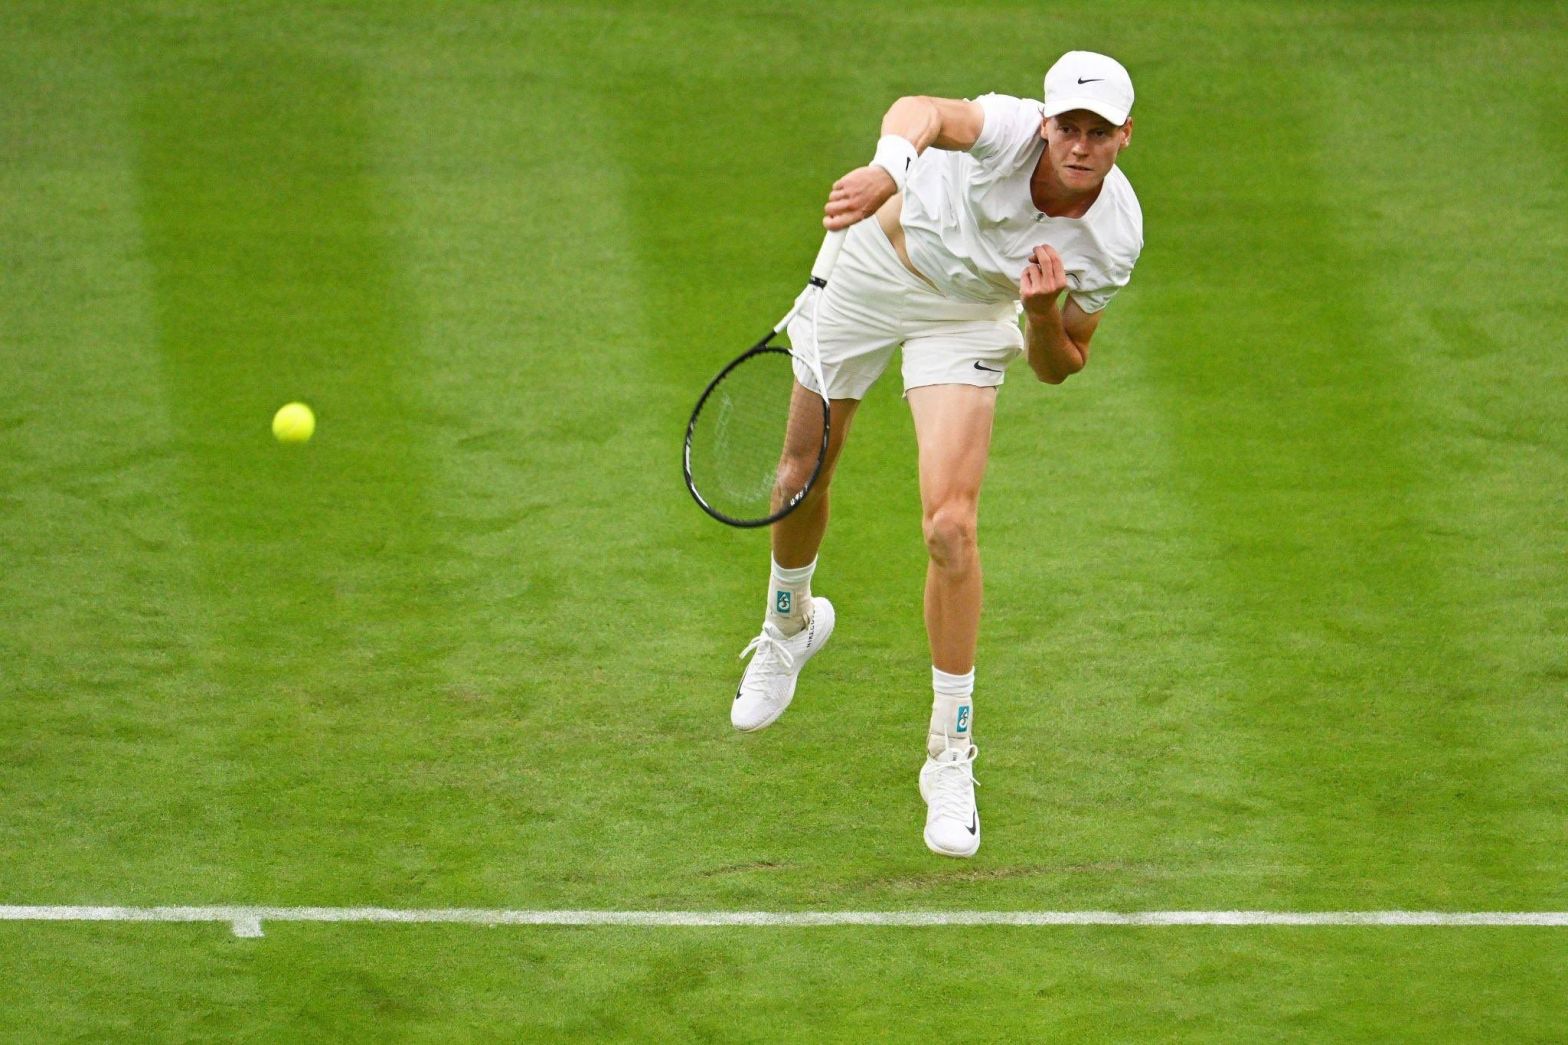
Besides needing to adjust to this new reality mentally and emotionally, I often get asked what the main differences are in the actual game, on-court, between high level junior and high level professional players. One area is the speed of the game, and I’d like to illustrate this point using second serve speed data from the men’s and boys’ draws from this year’s Wimbledon.
Below is a table that has the average second serve speeds from the boys’ draw on the left, and the men’s draw on the right. I looked at the round of 16 onwards in both cases, for 30 total data points each.
| Juniors: Avg 2nd Serve Speed (mph) | Round | Men: Avg 2nd Serve Speed (mph) | Round |
| 91 | R16 | 104 | R16 |
| 103 | R16 | 106 | R16 |
| 92 | R16 | 107 | R16 |
| 100 | R16 | 104 | R16 |
| 98 | R16 | 97 | R16 |
| 103 | R16 | 97 | R16 |
| 96 | R16 | 100 | R16 |
| 91 | R16 | 99 | R16 |
| 97 | R16 | 103 | R16 |
| 100 | R16 | 98 | R16 |
| 95 | R16 | 101 | R16 |
| 101 | R16 | 98 | R16 |
| 91 | R16 | 106 | R16 |
| 93 | R16 | 91 | R16 |
| 97 | R16 | 97 | R16 |
| 98 | R16 | 104 | R16 |
| 97 | QF | 104 | QF |
| 96 | QF | 110 | QF |
| 104 | QF | 100 | QF |
| 93 | QF | 101 | QF |
| 103 | QF | 106 | QF |
| 100 | QF | 103 | QF |
| 88 | QF | 96 | QF |
| 88 | QF | 107 | QF |
| 97 | SF | 110 | SF |
| 104 | SF | 105 | SF |
| 99 | SF | 107 | SF |
| 91 | SF | 106 | SF |
| 95 | F | 108 | F |
| 91 | F | 105 | F |
| 96.4 | Mean | 102.67 | |
| 22.52 | Variance | 20.99 |
Without going too deep into statistics, we would use something called an unpaired t-test to determine whether the difference in means between the two groups is statistically significant. In our particular case – we have 30 observation in each category, with the means and variances listed above – we get a p-value of less than 0.0001. We can conclude, with a high degree of certainty (in our case more than 99.999%) that we do have a statistically significant result. In our case, in layman’s terms, we can be fairly certain that the top pros hit their second serves at a higher speed than the top juniors.
I would argue that there are three components that go into an effective second serve:
- Speed
- Placement/depth
- Variety
All three play a role in keeping the opponent off-balance, and starting the point at a roughly equal footing. A greater speed gives a greater margin for error; all else equal, I’d rather miss my spot with a 100-mph second serve than with a 85-mph one.
The sample that I used has obvious limitations: I didn’t look at first serves, I didn’t look at the whole draw, and I only considered one tournament, on grass. But I think that it still illustrates, or at least suggests, that the speed of the game is different between the pro game and the juniors. If I was coaching a junior with professional tennis aspirations right now, getting his average second serve speed in the neighbourhood of 100mph would certainly be one of the metrics on my list.
